
Insights, Analytics & Presentation >>>
Is constant monitoring at the core of your business?
In the rapidly changing business environment having the most accurate and up-to-date performance information is crucial for managing your business. A solid proces for transforming data into valuable information requires not only a smooth process but in particular embedment within your entire organization.
When we look at the larger companies, acting on the basis of solid research is often an important condition. After all, a lot of derivative activities contribute significantly to the required investment load. Sufficient reason to make available special departments or competences that need a day job to gather this information.
In the past, it was virtually impossible to talk to everyone in your target group and explore what need was at play. It was practical, financially but also technically unfeasible. For that reason, the use of static calculations that estimated the need in a total population based on a representative group (in number, behavior or use) was a trusted method. However, with the development of computer technology and the strong growth of computing power and capacity for this purpose, a whole new range of possibilities emerged. Often referred to as Big-Data analysis, artificial intelligence or other analytical or prediction techniques.
The use of these new methods is also causing a real disruption in the research industry. The trusted research model is exchanged for a more iterative and fast method of information gathering based on a / b test principles. Supplemented with the required static data from other parts of the business, it makes insights and analyzes more suitable for making business decisions. It is also causing a trend to carry out much more of these activities in-house. Putting pressure on the research industry where standard research methods have to lose out in terms of lead time and yield against this agile research method.
Research Question
Each research activity usually starts from a clearly formulated briefing. Which question from the business forms the basis for the activities that we have to develop, and where exactly must an answer be found. Questioning is something that must be formulated from within the organization. Nowadays people often say “we will hire a data analyst”, but that does not give you clear research questions. The analyst also only plays a role in finding the correct findings.
Data Need
After determining this central question, it is important to determine which data is already available that can lead to the solution of the question. The insight into internal data sources, or a flexible attitude towards data collection and the design of triggers and tags play an important role in this. Adjusting and assessing these preparatory tasks before the actual analysis, can be seen as the key to successful analysis, as important pathways can be distilled which can then lead to an efficient collection operation.
Analysis
In such a case, the actual analysis is no more than following the patterns and from there identifying and substantiating the deviations. We are going to go a level deeper in analytic terms if correlations must be found within larger data sets. This is more on the mining-like side where a large part of the analytical power is derived from arithmetic / computer power. Unexpected matches or percentile deviations can be identified by means of algorithms, the human hand decides whether something should be done with it.
Reports, presenting or dashboarding
Collecting, analyzing and interpreting your data are the first steps in the research process, followed by an equally important step, which is the presentation of your findings. There is nowadays a broad variety of options available to do this. The central question here is what need exists within your organization when it comes to the efficient use of the insights obtained?
In the early 2000s, presenting your findings in a Powerpoint or Excel format was a fully accepted method that is still a standard for many organizations until now. The static character and, in addition, of course, the high degree of labor involved, is increasingly a stumbling block in many organizations. This is usually due to the enormous increased need for near / real-time information. A format that many a software manufacturer soon started to provide functional solutions with reporting or dashboarding functions in their solutions. Think of tools that are now widely accepted, such as google analytics. But also very specific tools such as SEO, social media monitoring or CRM tools

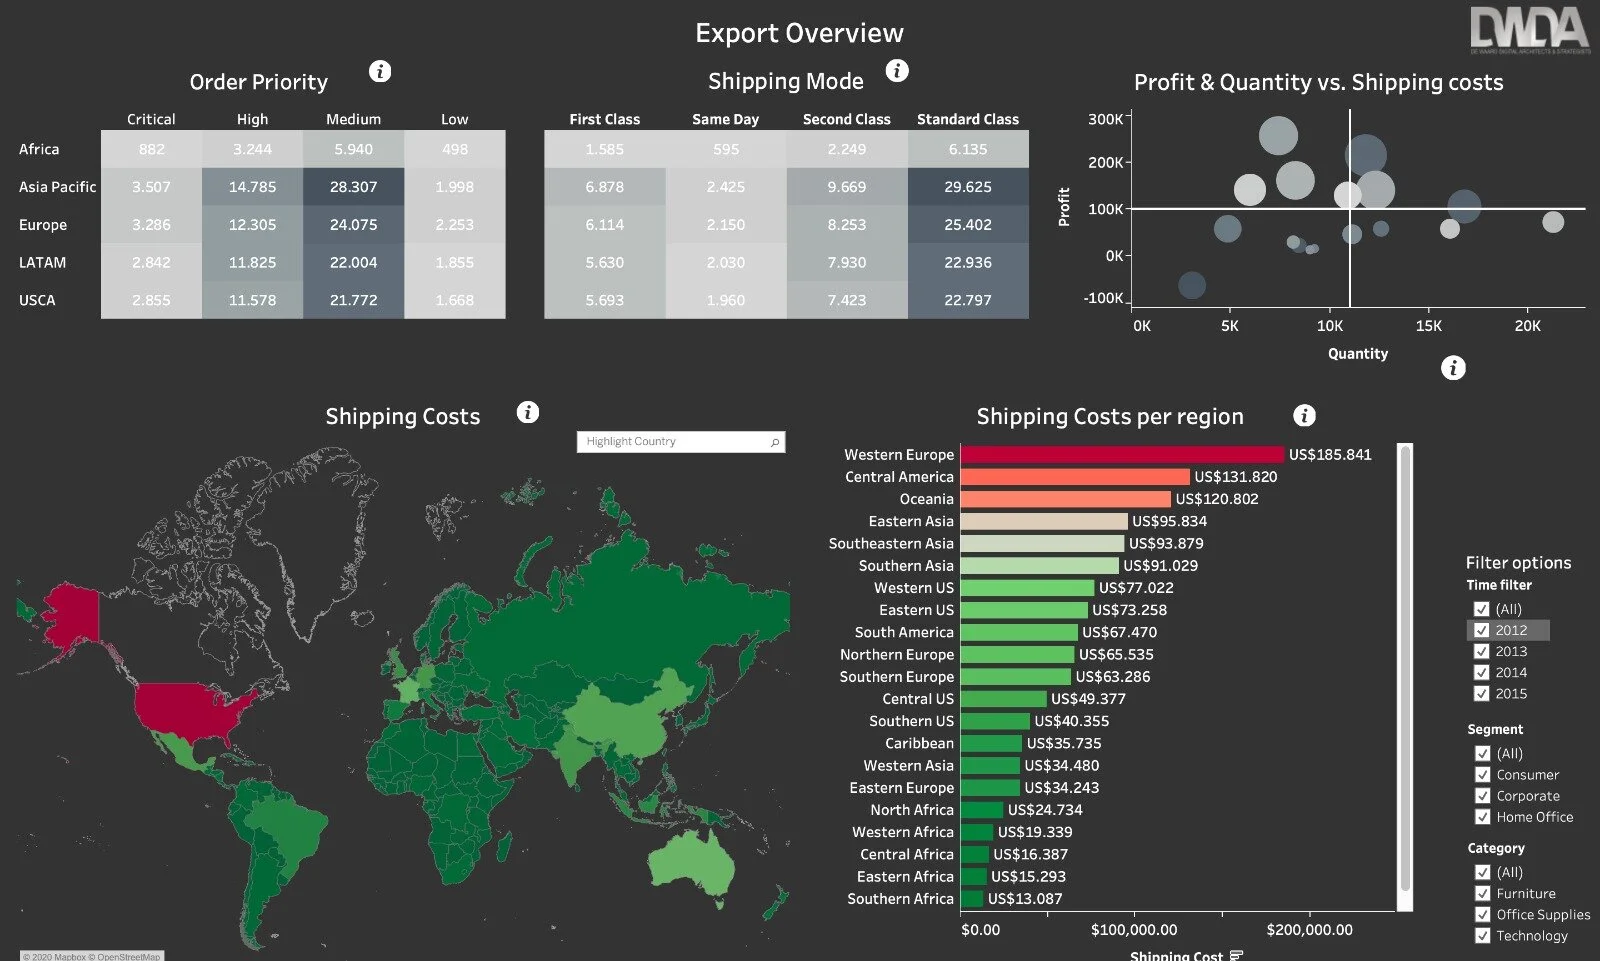
Example application report/dashboard
The wide variety of applications and thus also appearances and different presentation formats does not always benefit readability and interpretability. The emergence of dashboarding applications that can be configured as a filter over your various data sources are hot at the moment. From Klipfolio to QlikView and PowerBI to Tableau, all tools that are able to show a presentation shell of all topics that are important for running your business in an extremely user-friendly method. All from 1 structure or visual identity, with one pattern of presentation of graphs and tables and available in the time interval and via the device / screen of your need.
Your own company dashboards for quick and consistent insights
Web statistics

Business statistics

SEO statistics

Logistical statistics
Research statistics

Sales statistics

Campaign statistics

Social Media statistics